The equatorial Pacific swings between a warm state and a cool one, a swing called the El Niño–Southern Oscillation, or ENSO, and India's monsoon leans with it. This Guide shows the swing, how it reaches India, and what 8 strong El Niños and 6 strong La Niñas since 1950 did to rain, drought and harvests.
What the name means
ENSO: the El Niño–Southern Oscillation
El Niño: the sea
Fishermen in Peru named the warm water that came around Christmas El Niño, the Christ child. Its cool opposite is La Niña.
Southern Oscillation: the air
A see-saw of air pressure across the Pacific, read at Tahiti and Darwin. Gilbert Walker found it and named it.
ENSO: both, one swing
In the 1960s Jacob Bjerknes showed the sea and the air move together. The joined name has been used since.
Trade winds blow west and pile warm water up near Asia. Cold water rises off South America to replace it.
El Niño
The trade winds weaken. Warm water slides back east, and the rain goes with it.
La Niña
The trade winds blow harder than usual. More warm water gathers near Asia; more cold water rises in the east.
Watch one swing: 1997 to 1999
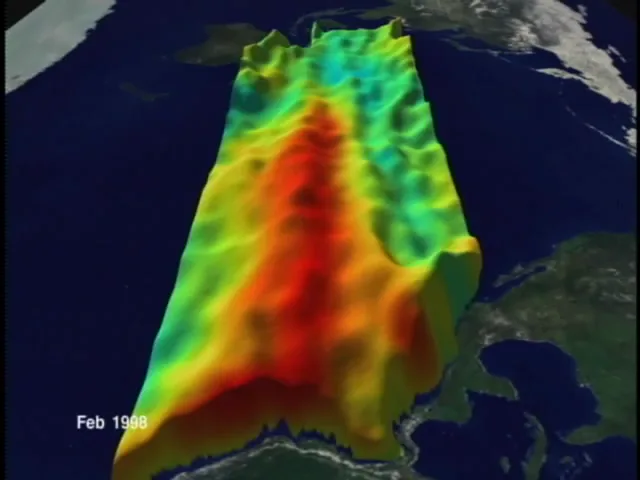
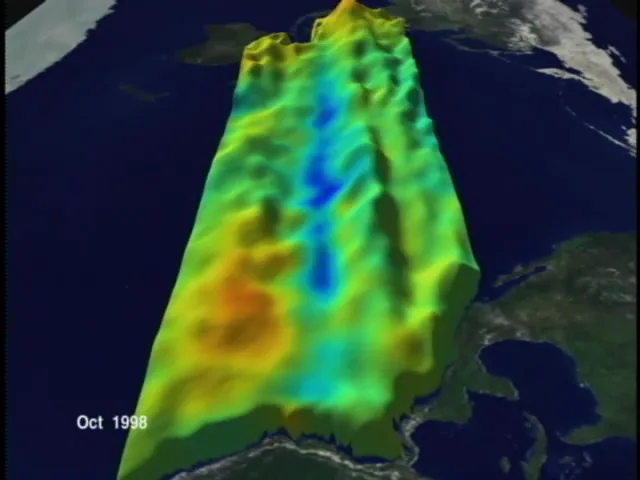
The Pacific seen from the east, January 1997 to February 1999. Colour is sea-surface temperature against normal (red warm, blue cool); height is sea level. No sound. Animation: NASA/Goddard Space Flight Center Scientific Visualization Studio, public domain.
The two ends of it
Late 1997, El Niño at full strength; late 1998, La Niña in its place. Frames from the NASA animation.
2 to 7 yearsbetween El Niños, on average, on no fixed schedule (NOAA)
The Pacific now
the map's opening view, redrawn every day
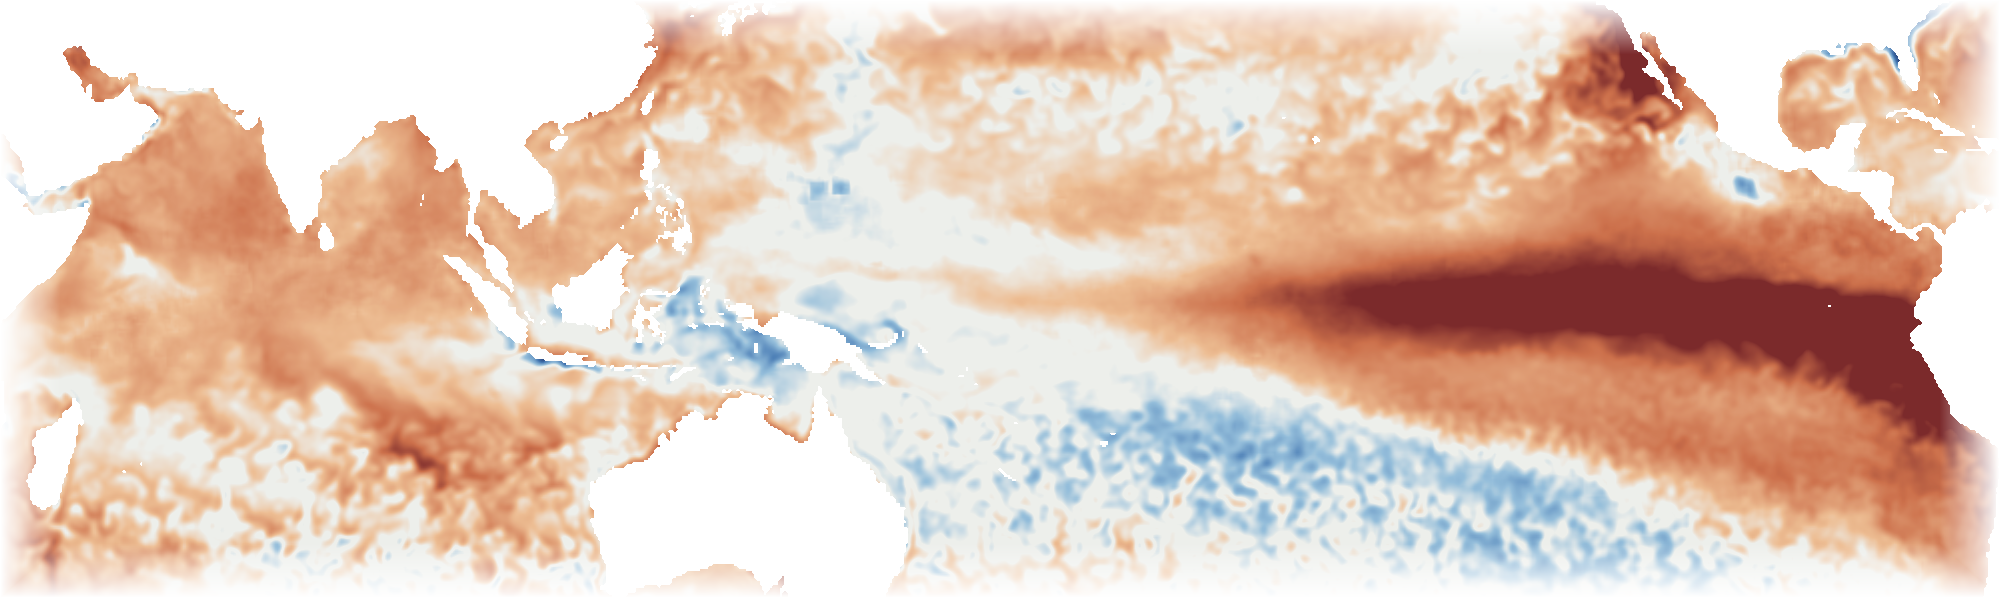
Sea-surface temperature against normal
Africa's coast on the left, South America on the right; red is warmer than normal, blue cooler. Mean of 7 days to 23 October 2026. Drawn by Maplore from NOAA's daily sea-surface temperature. Open it on the map.
Two yardsticks
The relative index July to September 2026 · rank 2, behind 1997 for those months since 1950 · NOAA's official measure since 2026+1.7 °CThe classic index highest for those months since 1950+2.2 °CThis week, in the box against 1971 to 2000+3.5 °C
The relative index subtracts the warming of the whole tropical ocean, so it reads lower. This atlas counts its events on the relative one.
The index, and what neutral means
one number for the state of the Pacific
The Pacific, every winter since 1950
Each bar is one year's relative index for November to January: how much warmer or cooler than usual the sea surface was in the central equatorial Pacific. Above half a degree is an El Niño. This atlas looks at the 8 years it reached 1.5 °C or more, in brown.
Where the lines are
El Niño or La Niña NOAA: half a degree either side, held for five overlapping seasons±0.5 °CStrong, in this atlas the winter value, November to January±1.5 °CStrong El Niño years8Strong La Niña years6Neutral years the benchmark for every count26
How the Pacific reaches India
through the air, not the water
An ordinary year
Air rises over the warm water around Indonesia, rains, and sinks far to the east.
An El Niño year
The rising air follows the warm water east. Sinking, drying air can spread as far as India.
A lean, not a rule
1997 index +2.3 °C, rank 2 of the 8 strong years · 26 % of districts deficient98 %2002 index +1.1 °C, not a strong year · rank 3 of 76 years for deficient districts52 % deficient
1997's monsoon as a share of a neutral year; 2002's share of districts with a deficient one. A very strong El Niño with near-normal rain; a modest one with one of the widest deficiencies.
The eight strong El Niños: Indian Ocean against monsoon
Each dot is one strong El Niño year: how the Indian Ocean stood in June to September, and how the monsoon came out. With 8 dots no line can be drawn through them; the Indian Ocean is not separated out in this atlas's counts.
The dipole
+0.7 °Cthis week: west of the Indian Ocean minus east
Positive when the western Indian Ocean is warmer than the east, off Sumatra. The strongest monsoon-season values since 1950: 2023 (+0.73), 2019 (+0.63) and 1972 (+0.58).
How to read the map
four readings on one switch
The Pacific
The ocean this week, the box the index is read in, and where the index stands.
Rain
drier in every event
drier in more than three quarters
drier in more than half
In how many strong years a district's season fell short of a neutral year. Three seasons; El Niño or La Niña.
Harvest
Older, larger regions whose yields fell short in El Niño years more often than in their own other years, crop by crop.
Drought
How often a district's monsoon fell into the weather department's deficient class. Tap any district, in any reading, for its own record.
What the record says
counted from India Meteorological Department rain, 1950 to 2025
The monsoon weakens
8 of 8strong El Niño years, all India
June to September rain fell short of a normal year every time, by 2 to 23 percent. 244 of 779 districts were drier in more than three quarters of the events.
But not everywhere
36districts drier in a third of the events or fewer
23 of the 36 are in Arunachal Pradesh, Assam and Jammu And Kashmir: over the north-east the Pacific tells the monsoon little. At the other end, 75 districts were drier in every single event, most of them in Chhattisgarh, Madhya Pradesh and Maharashtra.
And the year after is not weak
2 of 8following monsoons were drier
The monsoon of the year after a strong El Niño was at or above normal in 6 of 8 cases. The record does not support expecting a poor monsoon the summer after.
La Niña, the mirror
the same rain and the same count, for the 6 years the Pacific ran strongly cool
The monsoon strengthens
5 of 6strong La Niña years, all India
1973105 %
1988116 %
1998101 %
199994 %
2007108 %
2010106 %
June to September rain as a share of a typical neutral year. 1973, 1988, 1998, 1999, 2007, 2010: November to January index at −1.5 °C or lower.
Does it clear chance?
The monsoon 87 of 779 districts stand apart · chance up to 78does notOctober to December 76 of 697 districts stand apart · chance up to 70does notThe monsoon after 59 of 779 districts stand apart · chance up to 78does not
Each district's La Niña years against its own other years. For El Niño the monsoon count is 246 of 779, chance up to 78: the drying is the firmer signal.
And harvests
5 of 12crops with more good La Niña harvests than chance gives
Wheat 41 of 242
Soybean 18 of 72
Chickpea 38 of 216
Pigeonpea 29 of 188
Groundnut 41 of 172
Regions with yield above usual in La Niña years more often than in their own other years, on the longer record. Rice does not clear.
Drought
how often a district's monsoon fell into the weather department's deficient class, 1950 to 2025
Deficient monsoons, every year since 1950
In strong El Niño years 23 to 55 % of districts were deficient; in strong La Niña years 9 to 36 %. Of the six worst years, three were not strong El Niños: 1979, 1987 and 2002.
This one holds for districts
57districts hold alone, after allowing for 783 tests
Stand apart, El Niño chance up to 78246Stand apart, La Niña more deficient than in other years17
Each district's deficient El Niño monsoons against its own other years (22 % of them deficient, typically). See it on the map.
The classes
Large excess +60 % or more
Excess +20 to +59 %
Normal -19 to +19 %
Deficient -20 to -59 %
Large deficient -60 to -99 %
The India Meteorological Department's categories for rain against normal. Here "normal" is each district's own 1971 to 2020 average in the same gridded record, not the department's station normals.
What it is not
Not a declared drought. States declare drought on rain, crops, water and more. This is rain alone.
The count is the past. It ends with the 2025 monsoon and says how often, not whether now. For now, see the next tile.
Dry now
Districts dry on the standard index the 90 days to 23 October 2026 · −1 or lower192 of 779At −2 or lower40The 2026 monsoon: deficient or large deficient the weather department's classes, against each district's own average323 of 779Checked against the yearly record June to September 2022: districts in the same class99.2 %
The Standardized Precipitation Index says how unusual the last 90 days' rain is for the district and the season, against 1971 to 2020; drought is usually taken to begin at −1. Rain is the weather department's real-time daily grid, redrawn here each day. Rain alone: not a declared drought, and not a forecast. See it on the map, under Now.
And the harvest
rice first, then ten more crops; counted from the agriculture ministry's district table, 1998–99 to 2024–25
Districts below their usual rice yield, each year
Brown: El Niño years, from an index of +1.0 °C. The map counts only +1.5 °C and over; this table holds two of those. Usual: the district's own three years before and after.
Worse in three of four
2002–03 index +1.1 °C · median yield 90.3 % of usual73.3 %
2009–10 index +1.5 °C · median yield 95 % of usual63.7 %
2015–16 index +2.3 °C · median yield 97.6 % of usual55.9 %
2023–24 index +1.4 °C · median yield 103 % of usual37 %
An ordinary year48.1 %
2002, 2009 and 2015 put more districts below their usual yield than an ordinary year does. 2023 did not.
Rainfed fields carry it
Least irrigated third up to 36.8 % of rice irrigated89.5 %
Most irrigated third 97.5 % and over100.3 %
Median yield in the El Niño years, as a share of the district's usual, across 391 districts.
Why no district is coloured
49 of 424districts differ from their own ordinary years
Chance alone gives up to 42. Four harvests cannot tell one district from the next, so the map's Harvest reading colours older, larger regions instead.
The longer record
55 of 276older, larger units differ over 12 El Niño years
1968 to 2015, 1966 boundaries, all rice seasons. Chance alone: up to 28. More harvests do show a pattern, for regions rather than today's districts. See the regions on the map.
Crop by crop, the last four El Niño harvests
Pearl millet (bajra) 20 of 131 districts · chance up to 1315 %
Cotton 18 of 132 districts · chance up to 1314 %
Groundnut, monsoon 19 of 140 districts · chance up to 1414 %
Chickpea (gram) winter 28 of 209 districts · chance up to 2113 %
Wheat winter 43 of 366 districts · chance up to 3712 %
Rice 49 of 424 districts · chance up to 4212 %
Sorghum (jowar), monsoon 16 of 142 districts · chance up to 1411 %
Rapeseed and mustard winter 23 of 219 districts · chance up to 2211 %
Pigeonpea (tur) 18 of 173 districts · chance up to 1710 %
Maize 26 of 274 districts · chance up to 279 %
Black gram (urad) 15 of 178 districts · chance up to 188 %
Share of districts that fell short in El Niño years more often than in their own ordinary years. The tick is what chance alone gives. Clearly above it (half as many again): pearl millet. Among 11 crops, one or two would be by luck.
The same, on the longer record
Groundnut, monsoon 60 of 173 regions · chance up to 1735 %
Soybean 21 of 72 regions · chance up to 729 %
Maize 53 of 217 regions · chance up to 2224 %
Pearl millet (bajra) 31 of 138 regions · chance up to 1422 %
Rice 55 of 276 regions · chance up to 2820 %
Pigeonpea (tur) 37 of 188 regions · chance up to 1920 %
Cotton 24 of 126 regions · chance up to 1319 %
Sorghum (jowar), monsoon 28 of 184 regions · chance up to 1815 %
Wheat winter 36 of 242 regions · chance up to 2415 %
Rapeseed and mustard winter 21 of 165 regions · chance up to 1613 %
Chickpea (gram) winter 23 of 216 regions · chance up to 2211 %
Sugarcane 9 of 152 regions · chance up to 156 %
Up to 12 El Niño years, 1968 to 2015, 1966 boundaries. 9 of 12 crops clear chance here (half as many again). The map's Harvest reading draws these regions, crop by crop. Black gram and Green gram are not kept apart in the longer record, so they are not on the map. Those that still hold when the number tested is allowed for: groundnut 24, soybean 7, pearl millet 4, sorghum 4 and chickpea 1.
Winter crops: a different season
Wheat worse than an ordinary year (44.6 %) in 3 of 464 · 63 · 66 · 43 %Chickpea (gram) worse than an ordinary year (47.5 %) in 4 of 461 · 68 · 72 · 68 %Rapeseed and mustard worse than an ordinary year (50.8 %) in 2 of 481 · 47 · 68 · 47 %
Sown after the monsoon and cut in spring, so the count reads the El Niño winter and the soil moisture left behind. Years: 2002, 2009, 2015, 2023.
Crops not counted
Sesamum
Lentil
Finger millet (ragi)
Castor
Jute
Small millets
Barley
Sunflower
Other pulses
Winter sorghum
Soybean 98
Sugarcane 41
Green gram 86
Smaller crops, each under two million hectares, or not filed by season. soybean, sugarcane and green gram: fewer than 100 districts with enough El Niño harvests in the recent table (the number beside each).
What was counted, and what it cannot show
460 districts
monsoon-sown rice
final estimates
yield, kg a hectare
read 7 Oct 2026
Set to the state's own figure. The district rows add up to 94 to 117 % of the national rice figure. Each state's districts were scaled to the ministry's state yield: 133 of 757 state-years moved over 8 %, 91 left out.
Yield, not loss. A field abandoned before harvest does not lower yield, so a drought is understated.
Not a forecast. Four harvests say what happened, not what the next El Niño will do.
the measure this atlas counted on until October 2026, and NOAA until February 2026
Which years change
Strong El Niño years classic index: 2023 in place of 19918Strong La Niña years classic index: 1955 and 1975 in place of 1998 and 20106
The same rule on both: the winter value at or beyond 1.5 °C. The relative index takes out the warming of the whole tropical ocean, which lifts recent winters on the classic one.
Rain and drought
Monsoon, El Niño: districts that stand apart classic 232 · chance up to 78246Monsoon, La Niña classic 9787Deficient monsoons, El Niño: hold alone classic 7257
Harvests
Rice, longer record: regions that stand apart classic 95 · chance up to 2855Rice regions that hold alone classic 190El Niño years in the longer record classic 9; the wider list, +1.0 °C12
On the relative index the wider list takes in more weak years, and the rice regions that held on the classic index no longer do.
Words used here
El Niño, La Niña. The warm and cool phases of a see-saw in the tropical Pacific that shifts rain belts around the world. Together they are called ENSO.
The index. NOAA's three-month average of how far the central Pacific's surface temperature is from normal. The relative index, official since 2026, first subtracts the warming of the whole tropical ocean.
A normal year. Here, a year when the Pacific was neither warm nor cool. Each district's rain in an El Niño year is set against what such a year would have brought at that time.
Drier. Below that normal-year figure, by any amount. The percent beside it says by how much.
What it is not
Not a forecast. It says what happened in eight past events. A district that was drier in six of eight can still have a good year.
Not the whole cause. The Indian Ocean matters too: in 1997 a strong El Niño came with a near-normal monsoon. That is not separated out here yet.
Rain first. The map's first reading is only rain. Its Harvest reading counts yields for regions, not districts, and says nothing about reservoirs.
How each number is made: Method. Where the data comes from and how old it is: Data.